I was always a fan of trying new tools in order to create a personal arsenal for edged cases. Recently, I found a tool called Adalanche, which is capable of enumerating and visualizing ACLs between entities in the scope of the Active Directory.
我一直很喜欢尝试新工具,以便为边缘案例创建个人武器库。最近,我发现了一个名为 Adalanche 的工具,它能够枚举和可视化 Active Directory 范围内实体之间的 ACL。
Usually, Active Directory misconfigurations can be found within the ACLs, and they can often lead to obtaining domain administrative privileges by chaining various lateral movement or privilege escalation techniques together. A very simple example for that can be a vulnerable ADCS server to ESC1 attack. Another example could be finding out that the current owned user is local administrator on some machine and after data exfiltration, you find domain admin credentials.
通常,可以在 ACL 中找到 Active Directory 错误配置,并且它们通常可以通过将各种横向移动或权限提升技术链接在一起来获取域管理权限。一个非常简单的例子是易受 ESC1 攻击的 ADCS 服务器。另一个示例可能是发现当前拥有的用户是某些计算机上的本地管理员,并且在数据外泄后,你会找到域管理员凭据。
Mapping such attack vectors can be complicated without such tools, and while you should not be dependant of them, they are here to help, and they certainly do!
如果没有这些工具,映射此类攻击媒介可能会很复杂,虽然您不应该依赖它们,但它们可以提供帮助,而且它们确实可以!
While BloodHound is my rank #1 tool for enumerating and visualizing the Active Directory, I was also thrilled to try Adalanche, mainly because of curiosity in terms of UI, practical use and evasiveness. Turned out that this tool might be a hidden gem!
虽然 BloodHound 是我用于枚举和可视化 Active Directory 的排名 #1 工具,但我也很高兴尝试 Adalanche,主要是因为对 UI、实际使用和规避方面的好奇心。原来这个工具可能是一个隐藏的宝石!
If you prefer watching a video instead of reading, I already deployed a video about the topic on my channel:
如果您更喜欢观看视频而不是阅读,我已经在我的频道上部署了有关该主题的视频:
Also make sure to join my Discord where we share experience, knowledge and doing CTF together.
另外,请务必加入我的 Discord,在那里我们分享经验、知识和一起做 CTF。
And if you have further appreciation for my work, don’t hesitate to become my Patreon!
如果您对我的工作有进一步的欣赏,请不要犹豫,成为我的 Patreon!
#Why not just use BloodHound?
为什么不直接使用BloodHound呢?
Now here comes the question, why bother with Adalanche when I have BloodHound?
现在问题来了,当我拥有 BloodHound 时,为什么要打扰 Adalanche?
The answer is very simple, it is always a good idea to have alternatives for specific tools. Also, alternatives creates competition and this is a fundamental process of improving both of the sides, so its a win = win situation.
答案很简单,拥有特定工具的替代品总是一个好主意。此外,替代方案会产生竞争,这是改善双方的基本过程,因此这是一个双赢=双赢的局面。
Additionally, as you might already know, SharpHound (The data collector for BloodHound) is extremely signatured by various security mechanisms. I am aware that the signatures and the behavioral detections can be bypassed but sometimes its not a trivial process. For Instance, it is possible to land into an environment that is extremely well network segmented, so that you cannot get a C2 implant to run and you should rely on some kind of workarounds such as bind shells on specific ports, which not all C2 framework actually supports. Additionally, its possible that the network is restricted in such way, that you cannot just execute the python collector. On top of that, if the segmentation is combined with enforced endpoint protection, it can become even more challenging. This just makes the things more complicated and can effectively lose a day or two into just getting the basic AD enumeration.
此外,您可能已经知道,SharpHound(BloodHound 的数据收集器)具有各种安全机制的高度签名。我知道可以绕过签名和行为检测,但有时这不是一个微不足道的过程。例如,有可能进入一个网络分段非常好的环境,这样你就无法运行 C2 植入物,你应该依赖某种解决方法,例如在特定端口上绑定 shell,并非所有 C2 框架实际上都支持。此外,网络可能受到限制,您不能只执行 python 收集器。最重要的是,如果将分段与强制的端点保护相结合,它可能会变得更具挑战性。这只会使事情变得更加复杂,并且可能会浪费一两天的时间来获取基本的 AD 枚举。
On the other hand, Adalanche is a tool that can work as both a collector and a visualizer at the same time, while it is extremely evasive. Imagining the previous restricted scenario, if Adalanche is execute from a compromised machine with network access to the LDAP server, it is less likely to get detected and blocked.
另一方面,Adalanche 是一种既可以作为收集器又可以作为可视化工具的工具,同时它非常规避。想象一下之前受限制的场景,如果 Adalanche 是从具有对 LDAP 服务器的网络访问权限的受感染计算机执行的,则不太可能被检测到和阻止。
When operating from C2 framework, the Adalanche binary can be executed with any PE-execution module, if your C2 supports such!
当从 C2 框架运行时,Adalanche 二进制文件可以使用任何 PE 执行模块执行,如果您的 C2 支持这样的模块!
[BIG DISCLAIMER] I am aware that there are always various workarounds for all scenarios. The goal of this blog is not to question them, but to discuss and analyze the Adalanche tool.
[大免责声明]我知道所有方案总是有各种解决方法。本博客的目的不是质疑他们,而是讨论和分析 Adalanche 工具。
Now, let’s get an idea of what Adalanche actually looks like.
现在,让我们了解一下 Adalanche 的实际样子。
#Adalanche Overview Adalanche概览
Adalanche is go-written tool for collecting and analyzing data from Active Directory. It is capable of extracting potential attack vectors such as unconstrained delegation, ESC1, outdated servers, users with administrative privileges and more. It is extremely fast and compatible with each modern Operating System (OS).
Adalanche是用于从Active Directory收集和分析数据的编写工具。它能够提取潜在的攻击媒介,例如不受约束的委派、ESC1、过时的服务器、具有管理权限的用户等。它速度极快,并且与每个现代操作系统 (OS) 兼容。
One of the coolest features about Adalanche is that it is self-sufficient, which means, you do not need:
Adalanche 最酷的功能之一是它是自给自足的,这意味着您不需要:
- Database (like Neo4j) 数据库(如 Neo4j)
- Specific engine or runtime installed (like dotnet runtime)
已安装的特定引擎或运行时(如 dotnet 运行时) - Additional software (like a web server)
其他软件(如 Web 服务器)
All you need is the compiled binary and luck that you are in a vulnerable environment. Since the Adalanche is go-written, the same code can be compiled for both windows and *nix systems.
您所需要的只是编译好的二进制文件和运气,您处于易受攻击的环境中。由于 Adalanche 是 go-written 的,因此可以为 windows 和 *nix 系统编译相同的代码。
It is always a good idea to obfuscate the code and compile it yourself. Currently (January, 2024) the tool does not get signatured but most likely this will change in the near future!
混淆代码并自行编译始终是一个好主意。目前(2024 年 1 月)该工具尚未签名,但很可能在不久的将来会发生变化!
Adalanche can be run directly, with no arguments if it is launched from a domain joined windows machine. On the other hand it can also mimic bloodhound.py, scraping the LDAP from a machine with network access to the Domain Controller. It then stores the gathered data into a folder called data, which can be analyzed in the future. Now let’s analyze the different methods on how to get it running!
Adalanche 可以直接运行,如果它是从已加入域的 Windows 计算机启动的,则没有参数。另一方面,它还可以模拟 bloodhound.py,从具有域控制器网络访问权限的计算机中抓取 LDAP。然后,它将收集到的数据存储到一个名为 data 的文件夹中,以便将来进行分析。现在让我们分析一下如何让它运行的不同方法!
#Case 1: I am operating from a domain joined Windows computer
案例 1:我正在使用已加入域的 Windows 计算机进行操作
Adalanche is capable of detecting the context of the current user. In case you are operating from a domain joined machine, and from the context of a domain user, you do not need to supply any arguments! In this scenario it is enough to just download and execute the binary.
Adalanche能够检测当前用户的上下文。如果您从已加入域的计算机和域用户的上下文中操作,则无需提供任何参数!在这种情况下,只需下载并执行二进制文件就足够了。
This will perform all the scraping automatically, then Adalanche will automatically analyze the collected data and finally, it will host the results on 127.0.0.1:8080 while navigating your default browser to the web view.
这将自动执行所有抓取,然后 Adalanche 将自动分析收集的数据,最后,它将在将默认浏览器导航到 Web 视图 127.0.0.1:8080 时托管结果。
If everything went smooth, you should see something like this:
如果一切顺利,您应该看到如下内容:
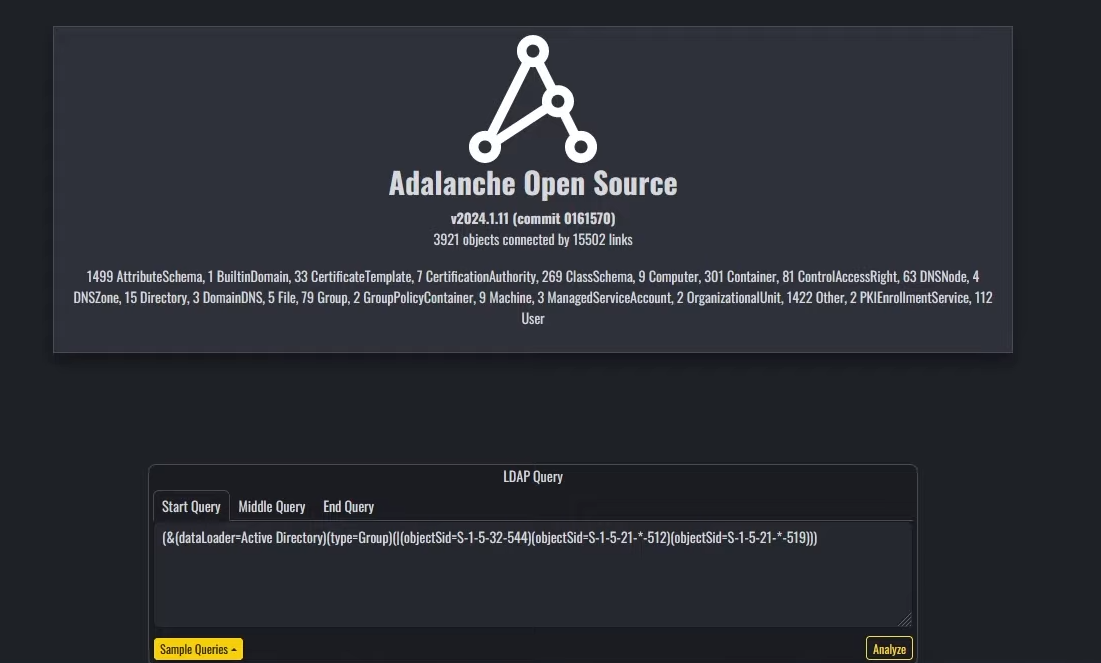
Entry screen of adalanche
adalanche的入口屏幕
#Case 2: I am operating from a host with VPN access and AD credentials
案例 2:我正在使用具有 VPN 访问权限和 AD 凭据的主机进行操作
Adalanche is also capable of scanning and extracting data from the Active Directory remotely. In this scenario, it is required to have network visibility to the LDAP servers as well as a valid pair of credentials for the Active Directory.
Adalanche 还能够远程扫描和提取 Active Directory 中的数据。在此方案中,需要对 LDAP 服务器具有网络可见性以及 Active Directory 的有效凭据对。
The Adalanche binary can now be used in 2 modes:
Adalanche 二进制文件现在可以在 2 种模式下使用:
- collect 收集
- analyze 分析
The first mode will perform the data collection via querying the LDAP service. After completion, again, all of the results will be stored in a folder called data unless you specify something different. All of the needed options can be found on the docs or by running:
第一种模式将通过查询LDAP服务来执行数据收集。同样,完成后,所有结果都将存储在一个名为 data 的文件夹中,除非您指定了其他内容。所有需要的选项都可以在文档中找到,也可以通过运行以下命令:
By following the options, this exemplary command can collect the data from the Active Directory:
通过遵循这些选项,此示例性命令可以从 Active Directory 收集数据:
After this command finishes, the data folder will be present in your current working directory.
此命令完成后,该 data 文件夹将出现在当前工作目录中。
Since all of the collected AD information is stored into that data folder, you can also zip and ship it somewhere else. Keep in mind that the dump can be analyzed offline as soon as the Adalanche binary is present. As already mentioned, the same binary can be used for both collection and analyzing the data.
由于所有收集的 AD 信息都存储在该 data 文件夹中,因此您也可以压缩并将其发送到其他地方。请记住,只要存在 Adalanche 二进制文件,就可以脱机分析转储。如前所述,相同的二进制文件可用于收集和分析数据。
When you are ready to analyze the results and generate a web view, you can do so by running:
当您准备好分析结果并生成 Web 视图时,可以通过运行以下命令来执行此操作:
If everything is running as expected, you should again see the initial screen of Adalanche:
如果一切按预期运行,您应该再次看到 Adalanche 的初始屏幕:
Entry screen of adalanche
adalanche的入口屏幕
#Adalanche Usage Adalanche 用法
Adalanche UI is divided into 3 parts:
Adalanche UI 分为 3 个部分:
- Object explorer on the left
左侧的对象资源管理器 - Nodes visualization settings on the right
右侧的节点可视化设置 - LDAP querying tool centered on the bottom.
LDAP查询工具以底部为中心。
On the Object explorer you can observe and analyze various objects, including present users, their groups, machines, Active Directory configurations and more.
在对象资源管理器上,您可以观察和分析各种对象,包括当前用户、其组、计算机、Active Directory 配置等。
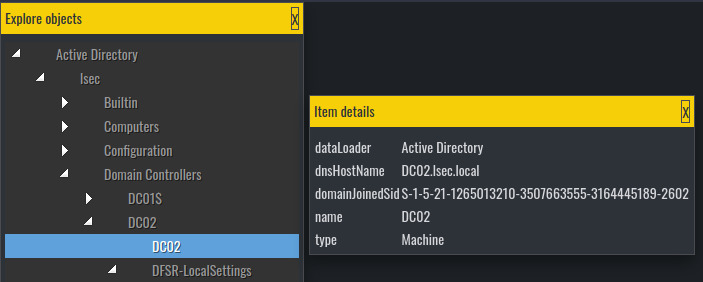
Object explorer 对象资源管理器
The data from the object explorer is the raw data from the LDAP server. Here you can find the values in various object fields, such as object description
对象资源管理器中的数据是 LDAP 服务器中的原始数据。在这里,您可以在各种对象字段中找到值,例如对象描述
On the right, you can tweak how the Adalanche should look like, but I personally did not spend much time on it since I was happy with the defaults.
在右侧,您可以调整 Adalanche 的外观,但我个人并没有花太多时间在上面,因为我对默认值感到满意。
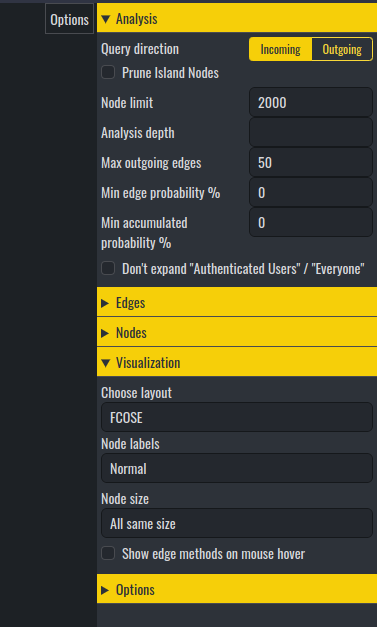
Adalanche visual options Adalanche 视觉选项
It is in the LDAP querying tool where it gets interesting.
在LDAP查询工具中,它变得有趣。
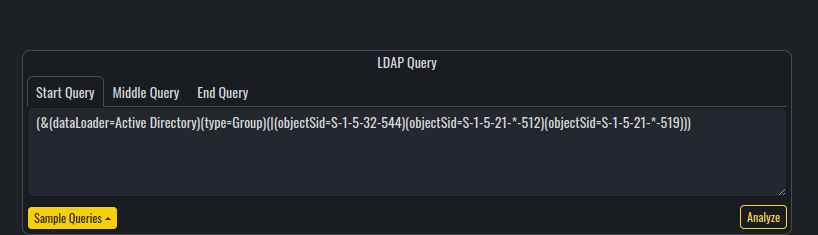
LDAP query section LDAP 查询部分
Compared to BloodHound, Adalanche is not using any database engines for storing the results. It is based entirely on LDAP to perform any visualization and analysis over the collected data (which is purely stored on the local file system). To visualize the results, Adalanche uses web view, which can be configured with the option --bind 'IP:PORT'.
与 BloodHound 相比,Adalanche 不使用任何数据库引擎来存储结果。它完全基于LDAP,可以对收集的数据(完全存储在本地文件系统上)执行任何可视化和分析。为了可视化结果,Adalanche 使用 Web 视图,可以使用选项 --bind 'IP:PORT' 进行配置。
This behavior has its pros and cons such as :
这种行为有其优点和缺点,例如:
Adalanche comes with the following predefined LDAP queries for visualizing nodes and searching for attack paths:
Adalanche 附带以下预定义的 LDAP 查询,用于可视化节点和搜索攻击路径:
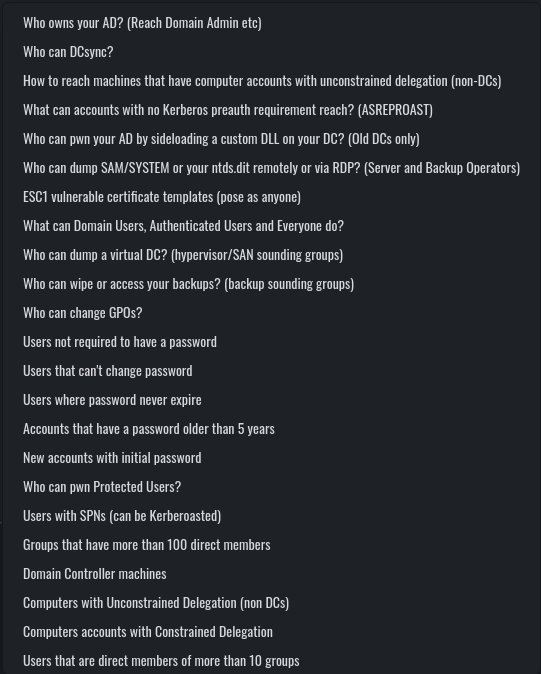
Builtin LDAP queries 内置 LDAP 查询
From these, you may notice that a lot of the queries are actually familiar from BloodHound (such as Kerberoastable users, DC Sync users and so on).
从这些中,您可能会注意到很多查询实际上是 BloodHound 熟悉的(例如 Kerberoastable 用户、DC Sync 用户等)。
One of the coolest parts about Adalanche, is that when you execute one of the queries, you get its raw syntax inside the LDAP querying section, from where you can modify and update the query to suit your needs.
关于Adalanche最酷的部分之一是,当你执行其中一个查询时,你会在LDAP查询部分获得它的原始语法,你可以从中修改和更新查询以满足你的需求。
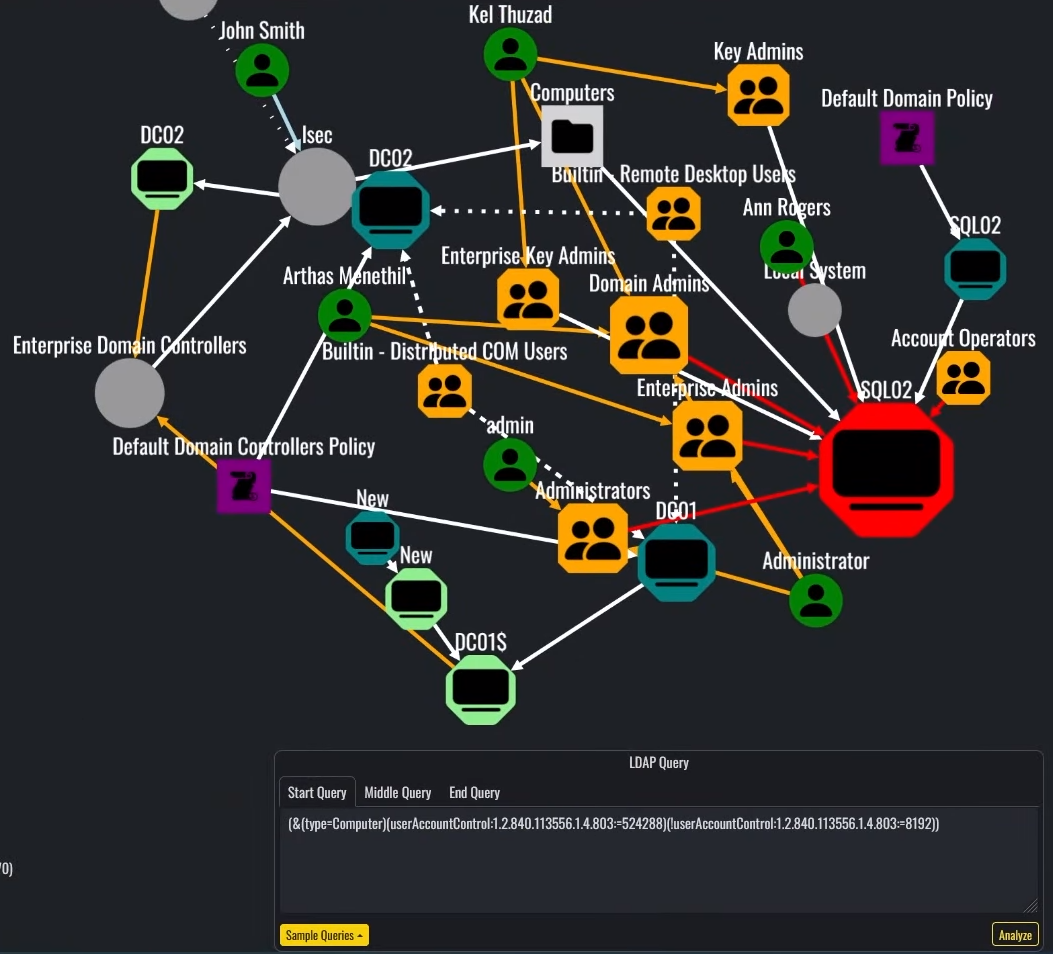
Query showing Unconstrained Delegation non-DC machines
显示无约束委派非 DC 计算机的查询
Additionally, the Start Query, Middle Query and End Query are query separators, which means, that you can implement your own custom nested queries for finding various attack paths, misconfigurations and vulnerabilities.
此外,和 是 End Query 查询分隔符,这意味着您可以实现自己的自定义嵌套查询,以查找各种攻击路径、错误配置 Start Query 和 Middle Query 漏洞。
Of course, one negative aspect would be that you need to be doing good with LDAP in order to implement anything custom and to get the most out of Adalanche, but on the other hand, I found out that the default queries are working pretty nice. While I find the output from some of them confusing, others like Who can change GPOs, ESC1 vulnerable certificate templates and Who can dump SAM/SYSTEM can be extremely easy to understand and useful.
当然,一个消极的方面是,你需要对LDAP做得很好,以便实现任何自定义并充分利用Adalanche,但另一方面,我发现默认查询工作得很好。虽然我发现其中一些的输出令人困惑,但其他的则喜欢 Who can change GPOs , ESC1 vulnerable certificate templates 并且 Who can dump SAM/SYSTEM 非常容易理解和有用。
Lets analyze the above executed query: (&(type=Computer)(userAccountControl:1.2.840.113556.1.4.803:=524288)(!userAccountControl:1.2.840.113556.1.4.803:=8192)) which is designed to show all computers which are marked for Unconstrained Delegation, and are not Domain Controllers. While at first the output can be a little messy, it makes sense when you start reading the lines.
让我们分析上面执行的查询: (&(type=Computer)(userAccountControl:1.2.840.113556.1.4.803:=524288)(!userAccountControl:1.2.840.113556.1.4.803:=8192)) 该查询旨在显示标记为“无约束委派”且不是域控制器的所有计算机。虽然一开始输出可能有点混乱,但当你开始阅读这些行时,它是有道理的。
Similar to BloodHound, when you click on the paths between objects, you can get additional details about various attributes and relationships. It is not as informative as BloodHound(the path does not give exploitation guides), but still can be quite useful when you are already aware of the most common AD attacks. For example, when you see a red link between nodes, Adalanche claims that there are dangerous permissions between them.
与BloodHound类似,当你点击对象之间的路径时,你可以获得关于各种属性和关系的更多细节。它不像 BloodHound 那样提供信息量(该路径不提供漏洞利用指南),但当您已经了解最常见的 AD 攻击时,它仍然非常有用。例如,当您看到节点之间的红色链接时,Adalanche 声称它们之间存在危险的权限。
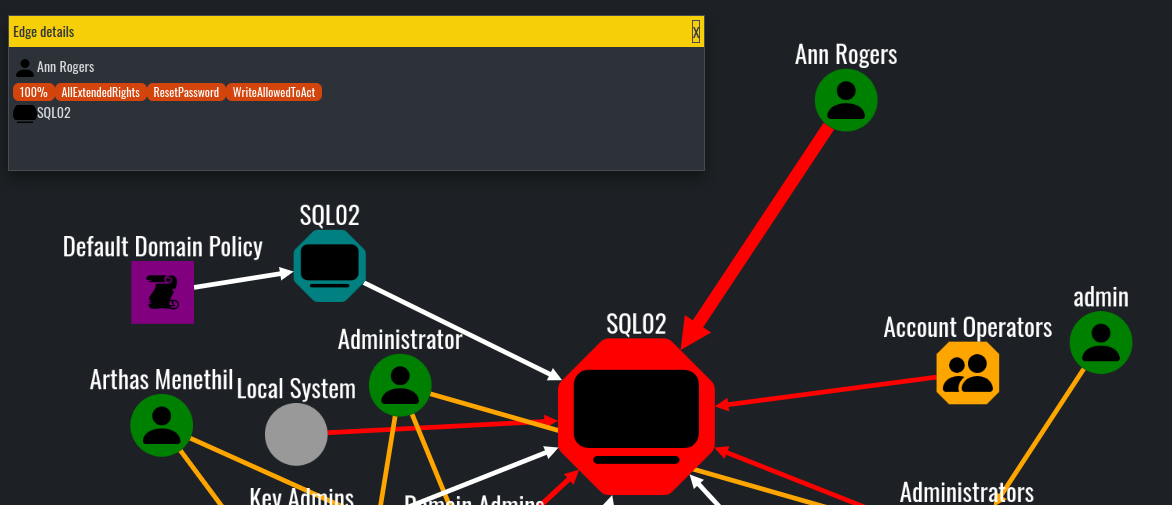
Ann Rogers has AllExtendedRights permissions over SQL02 machine
Ann Rogers 对 SQL02 计算机具有 AllExtendedRights 权限
By following the same logic, we can understand that the SQL02 is marked for Unconstrained Delegation, because its node is bigger and marked in red, compared to other machine accounts in the graph:
通过遵循相同的逻辑,我们可以理解 标记为 SQL02 Unconstrained Delegation,因为与图中的其他计算机帐户相比,它的节点更大并标记为红色:
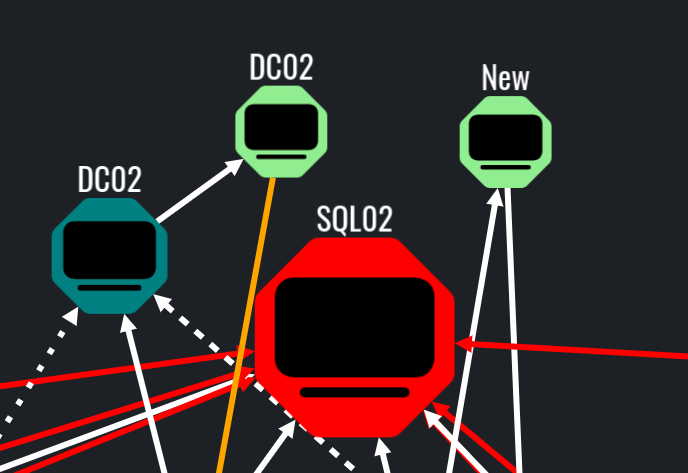
Exact query match in red, in this case SQL02 is allowed for Unconstrained Delegation
红色的精确查询匹配,在本例中,SQL02 允许用于无约束委派
Additionally, the orange links most of the times mean that the object is a member of specific group, while the white usually means that there is some form of connection between objects which is not dangerous or exploitable.
此外,橙色链接大多数时候表示对象是特定组的成员,而白色通常意味着对象之间存在某种形式的连接,这些连接并不危险或可利用。
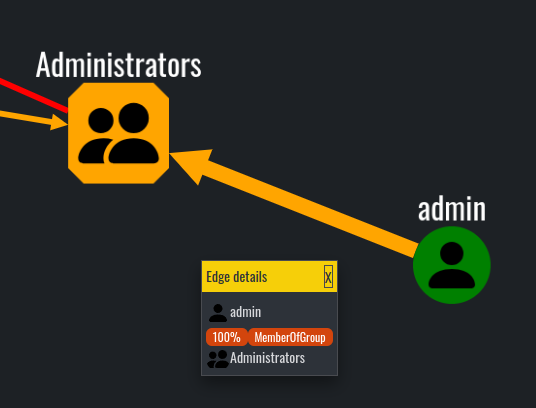
User admin is a member of the Administrators group, visualized with orange link
用户 admin 是 Administrators 组的成员,使用橙色链接进行可视化
With that, Adalanche has everything needed to find misconfigurations and vulnerabilities in the scope of the Active Directory. I know that there are a lot of features that are missing, compared to BloodHound, but still the essentials are here. One of the features I think Adalanche is lacking, is the exploitation docs on the node paths. Additionally, I found Adalanche hard to navigate and analyze specific single objects. Compared to BloodHound, where you can just type the object into the search box, here you would need to use LDAP queries. For example, in order to find a specific user, you can use the following LDAP query: (&(objectCategory=person)(objectClass=user)(sAMAccountName=username))
这样一来,Adalanche就拥有了在Active Directory范围内查找错误配置和漏洞所需的一切。我知道与 BloodHound 相比,缺少很多功能,但基本要素仍然存在。我认为 Adalanche 缺乏的功能之一是节点路径上的利用文档。此外,我发现 Adalanche 很难导航和分析特定的单个对象。与BloodHound相比,您只需在搜索框中输入对象即可,而BloodHound则需要使用LDAP查询。例如,为了查找特定用户,您可以使用以下 LDAP 查询: (&(objectCategory=person)(objectClass=user)(sAMAccountName=username))
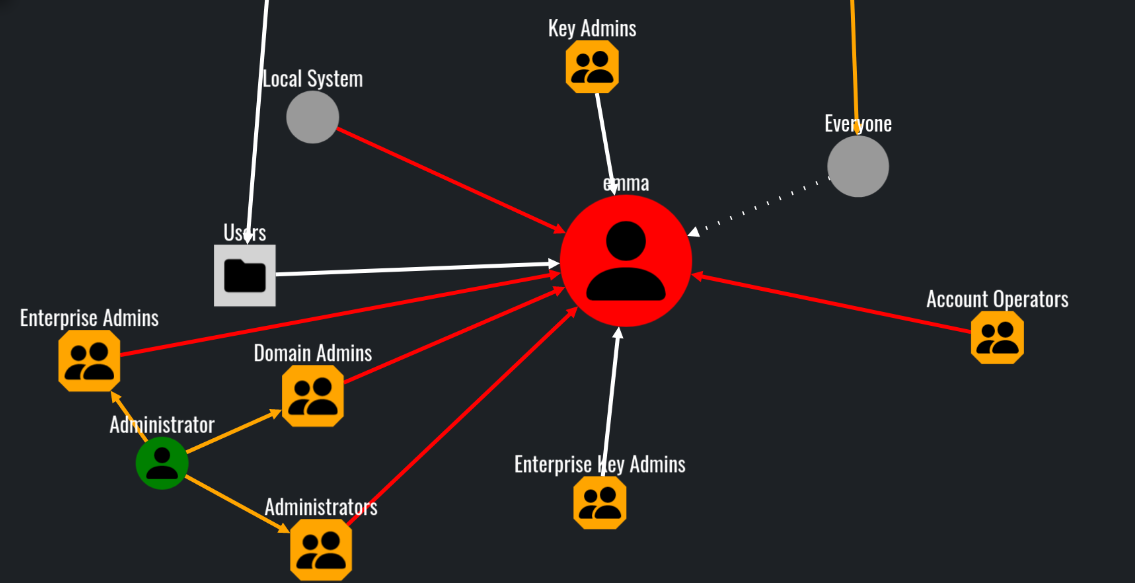
Querying the user emma, visualizing all objects that can directly influence her.
查询用户 emma,可视化所有可以直接影响她的对象。
Other features such as what can this node pwn and what can pwn this node I found to be extremely useful and practical. These options can be utilized into setting up a target or a starting point.
其他功能,例如 what can this node pwn what can pwn this node 我发现非常有用和实用。这些选项可用于设置目标或起点。
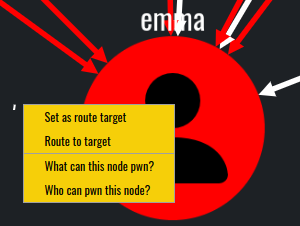
The whole idea of these options is to find attack paths to or from specific objects.
这些选项的整个想法是找到进出特定对象的攻击路径。
In this scenario, our user emma does not have direct dangerous and abusable ACLs toward any object in the domain.
在这种情况下,我们的用户 emma 对域中的任何对象都没有直接的危险和可滥用的 ACL。
Results from What can this node pwn? query
What can this node pwn? 查询结果
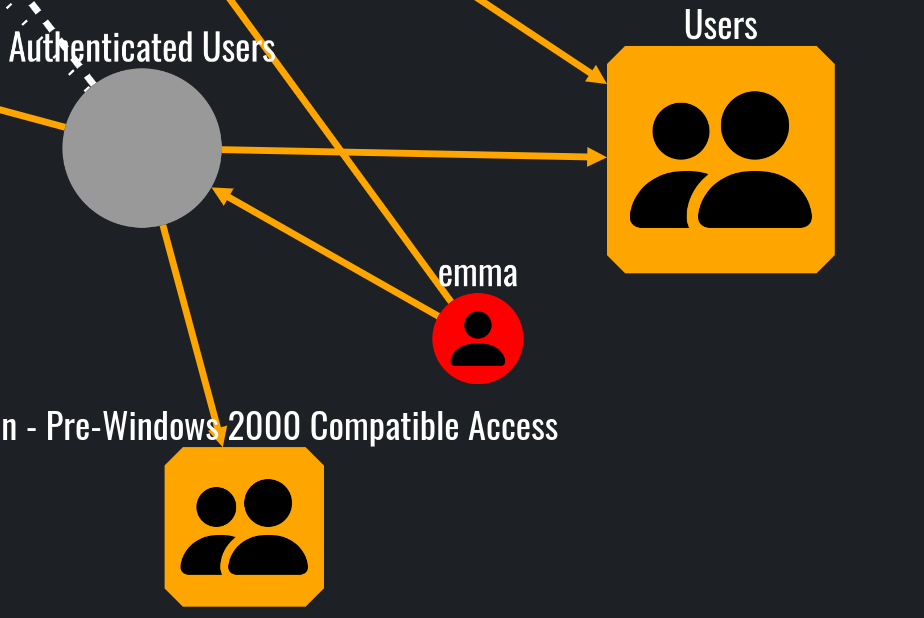
However, various objects can effectively influence and control emma:
然而,各种物体可以有效地影响和控制艾玛:
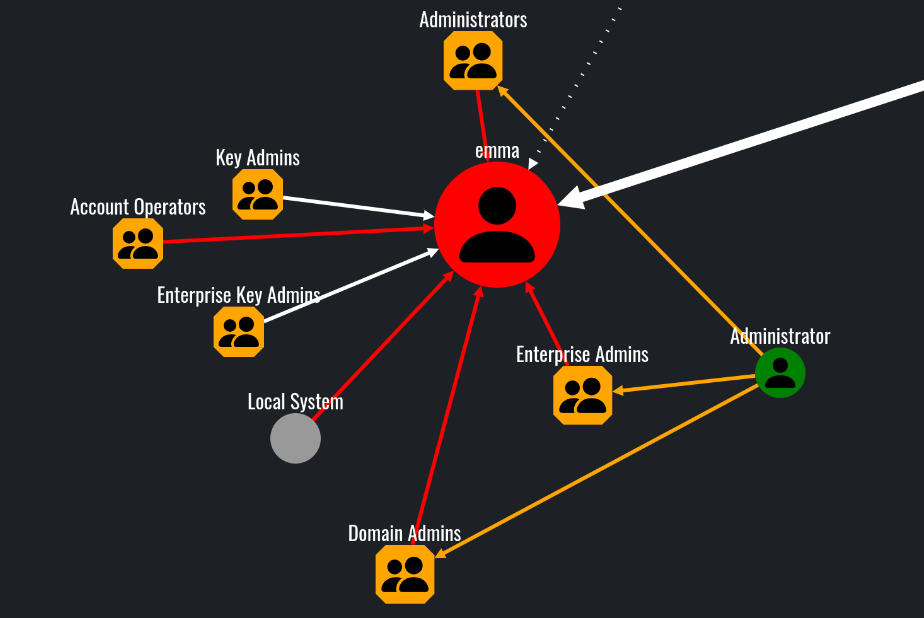
Results from Who can pwn this node? query
Who can pwn this node? 查询结果
Additionally, the options Set as route target and Route to target can be used to effectively display the attack path:
此外,这些选项 Set as route target Route to target 可用于有效地显示攻击路径:
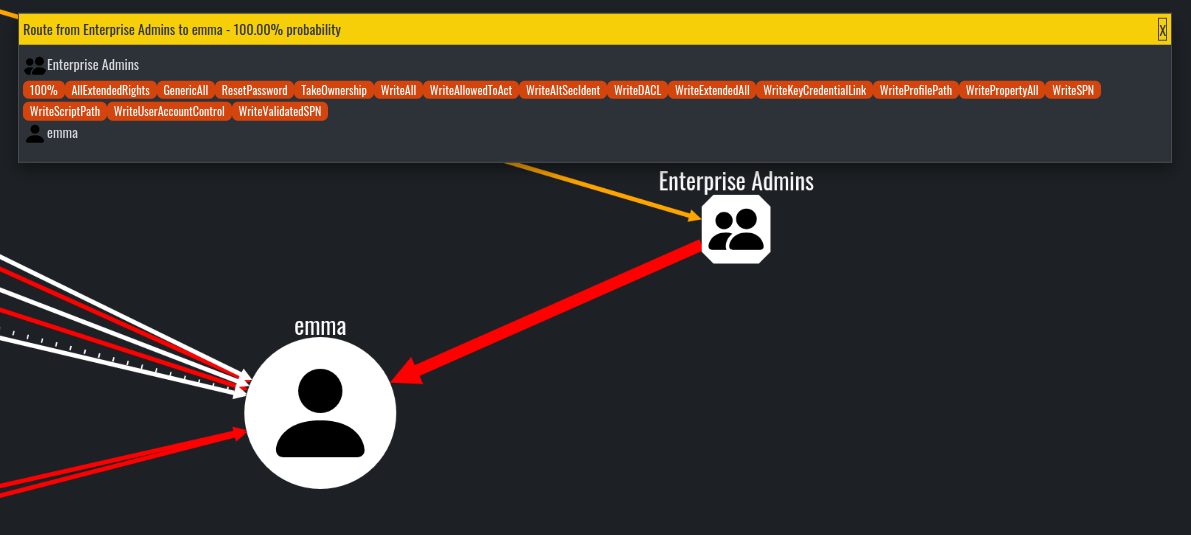
Results from setting emma as a target and running Route to target from Enterprise Admins group node
将 emma 设置为目标并从 Enterprise Admins 组节点运行 Route to target 的结果
#Conclusion 结论
Now it is your turn to try out the tool and decide for yourself if it is worth it or not! In my opinion, compared to BloodHound, Adalanche is worst at visuals but still can present useful information and real attack paths.
现在轮到您试用该工具并自己决定是否值得了!在我看来,与 BloodHound 相比,Adalanche 在视觉效果方面最差,但仍然可以提供有用的信息和真实的攻击路径。
While it can be initially confusing I think it is a great alternative which has its own pros and cons. I personally find the architecture pretty amazing and well done! The ability to be that flexible and evasive is something that must be credited, and we also need to acknowledge that the project is actively being developed and supported!
虽然它最初可能会令人困惑,但我认为这是一个很好的选择,它有其自身的优点和缺点。我个人觉得这个建筑非常棒,做得很好!这种灵活和规避的能力是必须值得称赞的,我们还需要承认该项目正在积极开发和支持!
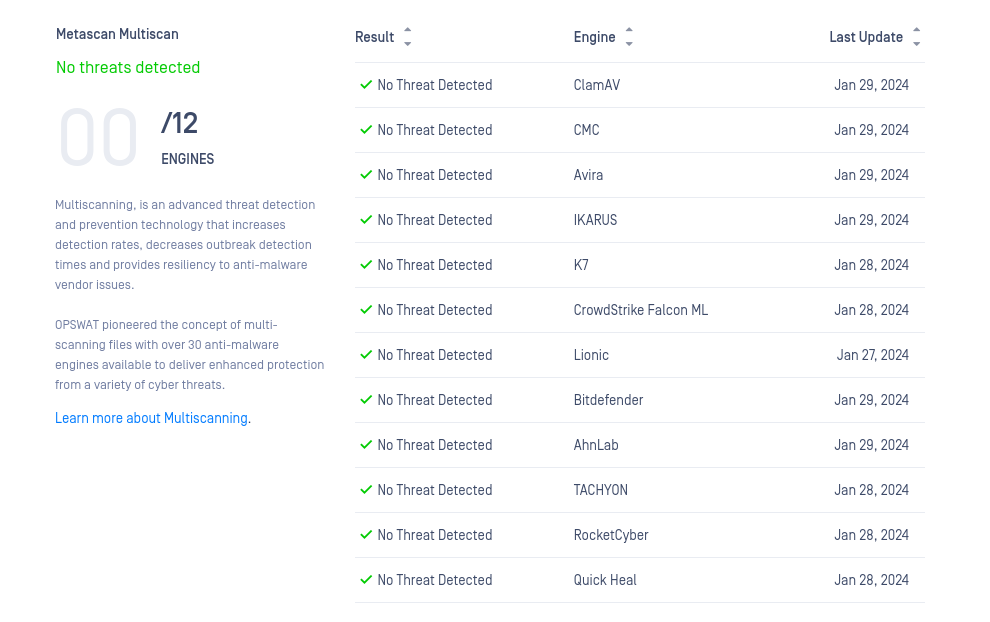
Metadefender scan results
Metadefender 扫描结果
I highly encourage you to try it out on your own and decide whether it is useful in your cases.
我强烈建议您自己尝试一下,并决定它是否适合您的情况。
原文始发于Carlos Vieira:Visualizing ACLs with Adalanche