Malware Unpacking With Hardware Breakpoints – Cobalt Strike Shellcode Loader
In previous posts here and here, we explored methods for extracting cobalt strike shellcode from script-based malware.
在之前的帖子中 这里 和 这里 ,我们探讨了从基于脚本的恶意软件中提取 cobalt strike shellcode 的方法。
In this post, we’ll explore a more complex situation where Cobalt Strike shellcode is loaded by a compiled executable .exe file. This will require the use of a debugger (x64dbg) in conjunction with Static Analysis (Ghidra) in order to perform a complete analysis.
在这篇文章中,我们将探讨一种更复杂的情况,即 Cobalt Strike shellcode 由编译的可 .exe 执行文件加载。这需要将调试器(x64dbg)与静态分析(Ghidra)结合使用,以便执行完整的分析。
Overview 概述
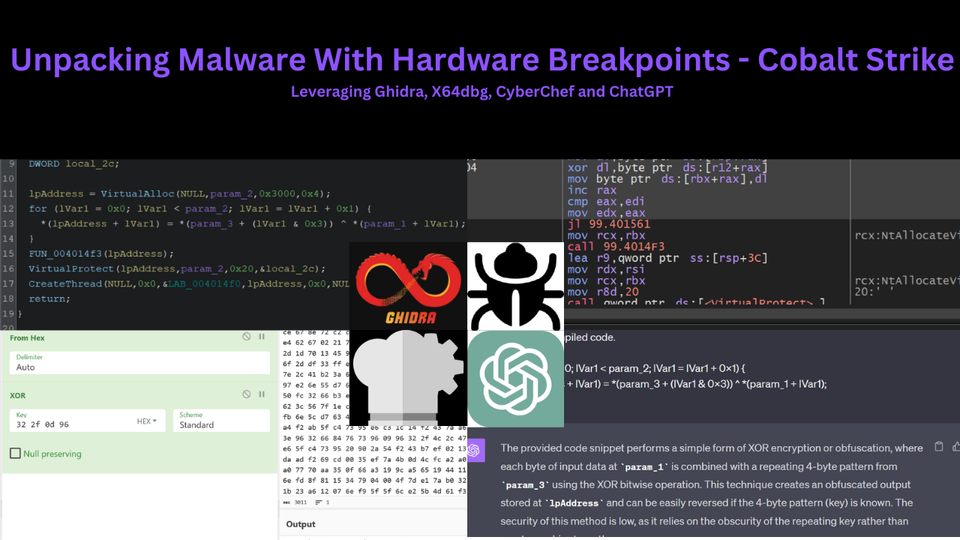
The executable is a compiled exe containing hidden and obfuscated Shellcode. The shellcode is decoded using a simple XOR routine and a 4-byte key, is then written to a simple buffer created with VirtualAlloc.
可执行文件是一个编译的 exe,其中包含隐藏和混淆的 Shellcode。使用简单的 XOR 例程和 4 字节密钥对 shellcode 进行解码,然后将其写入使用 VirtualAlloc 创建的简单缓冲区。
We will explore methods for obtaining the decoded shellcode using a debugger, and we will then explore methods for manually locating the Shellcode and associated decryption keys using Ghidra.
我们将探索使用调试器获取解码的 shellcode 的方法,然后我们将探索使用 Ghidra 手动定位 Shellcode 和相关解密密钥的方法。
We’ll also look at a way to pivot between X64dbg and Ghidra, as well as a method for identifying and analysing Ghidra output using ChatGPT.
我们还将研究一种在 X64dbg 和 Ghidra 之间切换的方法,以及一种使用 ChatGPT 识别和分析 Ghidra 输出的方法。
Obtaining the Sample 获取样本
You can follow along by downloading the sample here on Malware Bazaar (pw:infected)
您可以通过在 Malware Bazaar (pw: infected ) 上下载示例来跟进
SHA256: 99986d438ec146bbb8b5faa63ce47264750a8fdf508a4d4250a8e1e3d58377fd SHA256的: 99986d438ec146bbb8b5faa63ce47264750a8fdf508a4d4250a8e1e3d58377fd
Analysis 分析
We can begin by saving the file to an analysis machine and unzipping it with the password infected. From here we can also create a copy with a shorter file name.
我们可以先将文件保存到分析机器,然后用密码 infected 解压缩。从这里,我们还可以创建文件名较短的副本。

Since the file is a compiled executable, we can attempt to analyse it using a debugger. In this case x64dbg.
由于该文件是已编译的可执行文件,因此我们可以尝试使用调试器对其进行分析。在本例中为 x64dbg。
We can go ahead and open the file with x64dbg, clicking through until we reach the entry point.
我们可以继续使用 x64dbg 打开文件,单击直到到达入口点。

We can now go ahead and create some breakpoints on API’s that are commonly (but not always) used when malware is unpacking.
现在,我们可以继续在 API 上创建一些断点,这些断点通常(但并非总是)在恶意软件解包时使用。
We can go ahead and create 2 breakpoints by running bp VirtualAlloc and bp VirtualProtect
我们可以继续创建 2 个断点,方法是运行 bp VirtualAlloc 和 bp VirtualProtect

After creating the breakpoints, we can go ahead and allow the malware to continue (F9)
创建断点后,我们可以继续并允许恶意软件继续 (F9)
The malware will continue to run and trigger a breakpoint on VirtualAlloc.
恶意软件将继续运行并在 上 VirtualAlloc 触发断点。
Our primary purpose here is to obtain the buffer being created by VirtualAlloc, we can do this by using Execute Until Return.
我们在这里的主要目的是获取 VirtualAlloc 创建的缓冲区,我们可以使用 Execute Until Return .
“Execute Until Return” will allow the VirtualAlloc function to complete, but won’t allow any further actions to occur. This means we can easily obtain the address of the buffer that was created.
“执行直到返回”将允许 VirtualAlloc 函数完成,但不允许发生任何进一步的操作。这意味着我们可以轻松获取已创建的缓冲区的地址。
Viewing Memory Created by VirtualAlloc
查看 VirtualAlloc 创建的内存

After hitting execute until return. We can observe the address of the newly created buffer inside of RAX.
击中 execute until return .我们可以观察到 中 RAX 新创建的缓冲区的地址。
We want to go ahead and monitor this buffer for suspicious content and unpacked malware.
我们希望继续监视此缓冲区中的可疑内容和未打包的恶意软件。

We can begin the monitoring process by right-clicking on the address contained inside of RAX.
我们可以通过右键单击其中包含 RAX 的地址来开始监视过程。
From here we can select Follow in Dump. This will open the content of the buffer in the bottom-left window.
从这里我们可以选择 Follow in Dump .这将在左下角窗口中打开缓冲区的内容。

By clicking “Follow In Dump”, we can observe the contents of the dump in the bottom-left window.
通过单击“Follow In Dump”,我们可以在左下角的窗口中观察转储的内容。
We can note here that the buffer is empty and contains only 00.
我们可以在这里注意到,缓冲区是空的,只 00 包含 .

Monitoring Memory With Hardware Breakpoints
使用硬件断点监视内存
VirtualAlloc has finished creating an empty buffer and we have successfully found it.
VirtualAlloc 已经完成了空缓冲区的创建,我们已成功找到它。
We can now go ahead and monitor for changes to this buffer by creating a Hardware Breakpoint.
现在,我们可以通过创建一个 Hardware Breakpoint .
A hardware breakpoint can be created by selecting the first byte in the memory dump and Right Click -> Breakpoint -> Hardware, Access -> Byte
可以通过选择内存转储中的第一个字节和 Right Click -> Breakpoint -> Hardware, Access -> Byte

From here we can allow the malware to continue to execute.
从这里我们可以允许恶意软件继续执行。
We should soon see our hardware breakpoint triggered. With an FC byte contained in the first part of the buffer.
我们应该很快就会看到我们的硬件断点被触发。 FC 字节包含在缓冲区的第一部分。
We can recall from previous blogs that FC is a very common first byte in shellcode.
我们可以从以前的博客中回想起, FC 这是 shellcode 中非常常见的第一个字节。

At this point we want the malware to continue to fill up the buffer, but we don’t want it to do anything after that.
在这一点上,我们希望恶意软件继续填满缓冲区,但我们不希望它在那之后做任何事情。
We can go ahead and use another Execute Until Return . Which will allow the buffer to fill up. At which point we can monitor it’s contents.
我们可以继续使用另一个 Execute Until Return .这将使缓冲区填满。此时我们可以监控它的内容。
Below we can see the buffer after it has filled. We can see the first byte is 0xFC and there is a wininet string present in the initial bytes. From previous blogs (1, 2)we know that this could indicate shellcode.
下面我们可以看到缓冲区填满后的缓冲区。我们可以看到第一个字节是 0xFC ,初始字节中存在一个 wininet 字符串。从之前的博客 ( 1, 2) 中我们知道这可能表明 shellcode。

Validating Shellcode Using a Disassembler
使用反汇编程序验证 shellcode
Now that we have a reasonable assumption that the buffer contains shellcode, we can go ahead and try to disassemble it using X64dbg.
现在我们有一个合理的假设,缓冲区包含 shellcode,我们可以继续尝试使用 X64dbg 反汇编它。
If we disassemble the code and there are no glaring errors, then there is a very high chance that we are looking at shellcode.
如果我们反汇编代码并且没有明显的错误,那么我们很有可能正在查看 shellcode。
We can achieve this by selecting the first FC byte and Follow in Disassembler.
我们可以通过选择第一个 FC 字节和 Follow in Disassembler 来实现这一点。

X64dbg will now attempt to disassemble the bytes from our buffer.
X64dbg 现在将尝试从缓冲区中反汇编字节。
Below, we can observe the buffer disassembled in the top disassembly window. There appear to be no glaring errors, and there are valid function calls, loops and overall “normal” looking instructions.
下面,我们可以在顶部的反汇编窗口中观察到缓冲区的反汇编。似乎没有明显的错误,并且有有效的函数调用、循环和整体“正常”的指令。

Final Validation Using SpeakEasy Emulator
使用 SpeakEasy Emulator 进行最终验证
We now have a very high suspicion that the buffer contains shellcode. So we can go ahead and emulate it using Speakeasy.
我们现在非常怀疑缓冲区包含 shellcode。因此,我们可以继续使用 Speakeasy 来模拟它。
We could also achieve the same thing with X64dbg, but for shellcode, this is a much more involved process that will be covered in a later blog.
我们也可以使用 X64dbg 实现相同的目的,但对于 shellcode,这是一个更复杂的过程,将在后面的博客中介绍。
To emulate the shellcode using speakeasy, we first need to save it.
要使用 speakeasy 模拟 shellcode,我们首先需要保存它。
We can select our first FC byte, right-click and go to Follow in Memory Map
我们可以选择我们的第一个 FC 字节,右键单击并转到 Follow in Memory Map

From here we can save the memory buffer to a file.
从这里我们可以将内存缓冲区保存到文件中。
I will go ahead and save my file as memdump.bin.
我将继续将我的文件另存为 memdump.bin .

Emulating the Unpacked Shellcode with Speakeasy
使用 Speakeasy 模拟解压缩的 Shellcode
With the shellcode buffer now saved to a file memdump.bin. We can go ahead and emulate the shellcode using Speakeasy.
现在将 shellcode 缓冲区保存到文件 memdump.bin .我们可以继续使用 Speakeasy 模拟 shellcode。
We can do this with the command speakeasy -t memdump.bin -r -a x64
我们可以使用命令 speakeasy -t memdump.bin -r -a x64 来做到这一点
speakeasy– Runs the speakeasy tool
speakeasy– 运行地下酒吧工具-t– Which file we want to use
-t– 我们要使用哪个文件-r– (Raw) – Indicates that we are using shellcode
-r– (Raw) – 表示我们正在使用 shellcode-a x64– Indicates that our file contains 64-bit instructions. (we know this as we’re using x64dbg and not x32dbg)
-a x64– 表示我们的文件包含 64 位指令。(我们知道这一点,因为我们使用的是 x64dbg 而不是 x32dbg)
Upon running this command, the shellcode is emulated successfully and we are given a lot of information about it’s functionality.
运行此命令后,shellcode 将成功模拟,并且我们将获得有关其功能的大量信息。

The Speakeasy output shows a C2 address of 116.62[.]138.47, as well as a partial url of /8yHd.
Speakeasy 输出显示 的 C2 地址为 116.62[.]138.47 ,部分网址为 /8yHd 。
We can also see references to a user agent of User-Agent: Mozilla/4.0 (compatible; MSIE 8.0; Windows NT 5.1; Trident/4.0; InfoPath.2; .NET CLR 2.0.50727)\r\n
我们还可以看到对 User-Agent: Mozilla/4.0 (compatible; MSIE 8.0; Windows NT 5.1; Trident/4.0; InfoPath.2; .NET CLR 2.0.50727)\r\n
(This user agent would be a great place to go hunting in proxy logs if you had them available)
(如果您有代理日志,此用户代理将是一个在代理日志中搜寻的好地方)

Locating the Shellcode Decryption Function In Ghidra
在 Ghidra 中查找 shellcode 解密函数
At the point where the hardware breakpoint was first triggered, the primary executable was likely in the middle of the decryption function. We can use this information to locate the same decryption function within Ghidra.
在首次触发硬件断点时,主可执行文件可能位于解密函数的中间。我们可以使用这些信息在 Ghidra 中找到相同的解密函数。
From here, we can do some interesting things which are covered in the next 7 sections.
从这里开始,我们可以做一些有趣的事情,在接下来的 7 个部分中介绍。
- Locating the Shellcode Decryption Function In Ghidra
在 Ghidra 中查找 shellcode 解密函数 - Identifying Decryption Routine Logic With ChatGPT
使用 ChatGPT 识别解密例程逻辑 - Identifying the Decryption Key Using Ghidra
使用 Ghidra 识别解密密钥 - Locating the Encrypted Shellcode Using Entropy
使用熵查找加密的 shellcode - Performing Manual Decoding Using Cyberchef
使用 Cyberchef 执行手动解码 - Hunting For Additional Samples Using Decryption Bytes
使用解密字节搜寻其他示例 - Creating a Yara Rule Using Decryption Code
使用解密代码创建 Yara 规则
原文始发于embee-research:Malware Unpacking With Hardware Breakpoints – Cobalt Strike Shellcode Loader
转载请注明:Malware Unpacking With Hardware Breakpoints – Cobalt Strike Shellcode Loader | CTF导航